tensorflow serving tfx docker 部署和requests.post使用教程(三)
1.使用models/maimai/versions/5的示例如下:
import json data = json.dumps({"signature_name": "serving_default", "instances": train_x[0:2].tolist()}) ''' data = json.dumps( { "signature_name": "serving_default", "inputs":{ "lstm_4_input":train_x[0:2].tolist(), } } ) ''' print('Data: {} ... {}'.format(data[:50], data[len(data)-52:])) #out:Data: {"signature_name": "serving_default", "inputs": {" ... 13464355, 1.57715904712677, -0.5041743516921997]]]}} import requests headers = {"content-type": "application/json"} json_response = requests.post('http://101.132.96.35:8501/v1/models/maimai/versions/5:predict', data=data, headers=headers) #predictions = json.loads(json_response.text)['predictions'] predictions = json.loads(json_response.text) print(predictions) #out:{'outputs': [[1.0228374], [1.00419593]]}2.使用models/stylegan的示例代码如下:
import numpy as np tn_style_block = 5 tlatent_dim = 100 tz1 = np.random.normal(0, 1, size=(1, 1, tlatent_dim)) tz2 = np.random.normal(0, 1, size=(1, 1, tlatent_dim)) tnoise = np.random.normal(0, 1, [len(tz1), 64, 64]) tn_z1 = 1 tinputs = [ np.ones((len(tz1), 1)), np.concatenate( (tz1.repeat(tn_z1, axis=1), np.repeat(tz2, tn_style_block - tn_z1, axis=1)), axis=1 ), tnoise, ] print(tinputs[0].shape) print(tinputs[1].shape) print(tinputs[2].shape) #out:(1, 1) #out:(1, 5, 100) #out:(1, 64, 64) import json data = json.dumps( { "signature_name": "serving_default", "inputs":{ "ones":tinputs[0].tolist(), "noise":tinputs[2].tolist(), "z":tinputs[1].tolist() } } ) #print(data) import requests from matplotlib import pyplot as plt headers = {"content-type": "application/json"} json_response = requests.post('http://101.132.96.35:8501/v1/models/stylegan:predict', data=data, headers=headers) predictions = json.loads(json_response.text)['outputs'] #predictions = json.loads(json_response.text) print(predictions) outputs = np.array(predictions) img = np.squeeze(outputs) img = ((img + 1.0) * 127.5).astype(np.uint8) plt.imshow(img) #out:[[[[-0.73119241, -0.666095853, -0.674581647], 。。。。 #out:<matplotlib.image.AxesImage at 0x7f1b54851d10>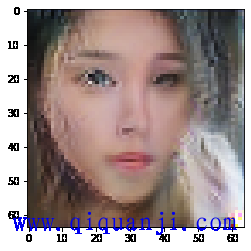
版权声明:本文为期权记的原创文章,遵循CC 4.0 BY-SA版权协议,转载请附上原文出处链接及本声明。
原文链接:https://www.qiquanji.com/mip/post/13968.html
微信扫码关注
更新实时通知